|
The table below shows my 2020 regular season projections for team record. The projections were created using team performance data from 2015 to 2019. Additionally, I gathered 2020 team performance projections from fangraphs.com using the data provided for each team like is found here for the 2020 Phillies. Update: It was kindly pointed out to me that my projections had given out more wins than was possible in a single season. Please see the final "Update" section to see how I modified my predictions to address this issue and how it changed my predictions. The table below is updated to reflect those changes. 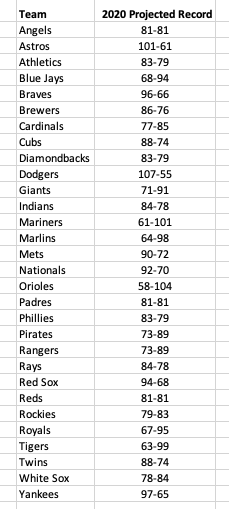 Having 2020 projections gave me some statistics to use for my 2020 predictions that account for roster changes, player development, and players regressing to their true skill level (up or down). The effects of roster changes season-to-season was something I was particularly interested in and this was one option I came up with that would reflect any major movement of players. Unfortunately, this is also the greatest flaw in this model. Past seasons' projections are not available so the model is trained using the actual performance in the same season. Therefore I am relying heavily on the accuracy of the 2020 projection data I feed into the model which may not be a good assumption to make. This all introduces some look-ahead bias and should be addressed in future iterations of the model. Model Summary The model is built using multiple linear regression with features selected using recursive feature elimination (RFE) and parameters tuned using grid search and cross-validation. The original features provided to the model are based on what statistics fangraphs projected for 2020. The following features were provided for the training data: Previous Season (eg. for 2019 predictions this is 2018 stats) Batting Average On-base Percentage Slugging Percentage wOBA Batting & Base-running Runs BsR Defensive Runs WAR from Position Players K/9 BB/9 HR/9 BABIP for Pitchers LOB % ERA FIP WAR from Pitchers Team Win Total Current Season (eg. for 2019 predictions this is 2019 stats) Batting Average On-base Percentage Slugging Percentage wOBA Batting & Base-running Runs BsR Defensive Runs WAR from Position Players K/9 BB/9 HR/9 BABIP for Pitchers LOB % ERA FIP WAR from Pitchers These features were then tested using RFE with mean average error as the scoring system. Following this feature selection analysis, the following features were used in the final remaining models: Batting Average in Previous Season On-base Percentage Batting Average BABIP in Pervious Season Slugging Percentage BABIP wOBA ERA wOBA in Pervious Season Slugging Percentage in Pervious Season On-base Percentage in Previous Season LOB % These features seem reasonable to use for projections. Some features like wOBA and previous season BABIP make sense and likely would have been used if features were hand-picked while others, like previous season batting average are less expected. My next step in model training was cross-validation and parameter tuning. I used a grid search and 5-fold cross validation on team win totals from 2016-2018. I held out the 2019 data to do a final test and evaluate the performance. The results of that test are shown in the table below. (Table below shows values before update and scaling discussed later). 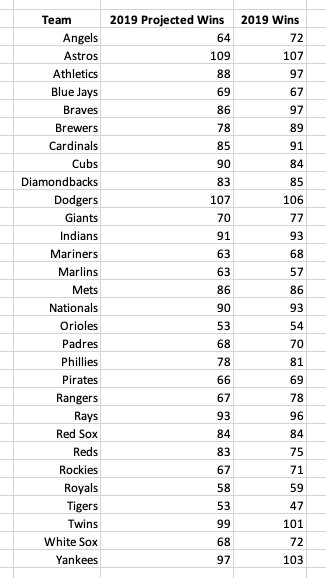 The mean average error for the 2019 predictions was 4.26 games. The model did a good job with teams that had especially good and bad seasons. The largest error was 11 wins and all three teams (Braves, Brewers, and Rangers) outperformed their projections. I felt good about this MAE value and performance overall so I decided to move forward to 2020 predictions. I combined all of the data from 2015-2019, trained the model a final time before making predictions for 2020. (Table below shows values before update and scaling discussed later). 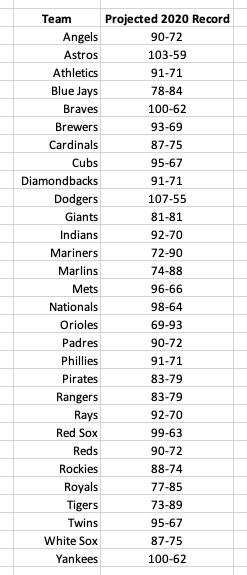 Update: Scaling to 2430 Total Wins It came to my attention that the original projections I created did not have a limitation on how many wins could be earned across the league. In my 2019 projections there were only 2356 wins and in my 2020 projections there were 2665 wins, 235 more than is possible. This meant that I needed to find a way to scale my win totals to match a 2430 game season. Upon looking at my data I also noticed that my projections skewed a little high. The lowest win total in 2020 was 69 wins but in 2019 there were four team below 60 wins. With this in mind I decided to scale my wins by penalizing poor teams' projections more than good teams' using their projected ranking. Subtracting the natural log of the team's ranking eliminated 75 wins so I scaled that to match the 235 wins I needed to eliminate in 2020. Using the natural log allowed for the worst team to be penalized the most with decreasing effects as a team's ranking increased. These steps and the number of wins removed for each team in 2020 are shown below. 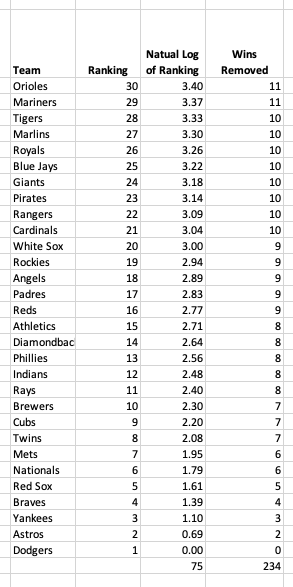 The effect of this change on my predictions was not insignificant. Some teams lost as many as 11 wins. The old and new predictions for 2020 can be seen in the table below. 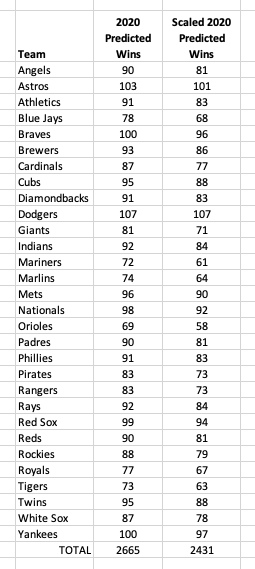 Similarly, 2019 predictions were changed to add the missing 74 games. This change improved my model performance decreasing the MAE from 4.5 to 3.8. The table below shows those changes and the actual 2019 win totals. 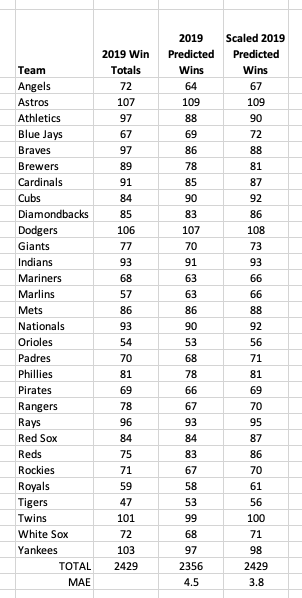 Only time will tell if these predictions are any good. I will follow up in the winter with an assessment and any updates I am planning for the 2021 season.
0 Comments
|
